


Why traffic estimates are ultra-important
Urban planners, engineers and policymakers use traffic projections to settle everything from how many parking spaces a property needs to whether to widen roads, lengthen signal cycles or reduce housing or retail plans. What would happen if these estimates were faulty? Funds would be diverted from projects that really need them. Housing costs could rise. And new developments would be designed around cars taking “phantom trips” — nonexistent rides based on bad numbers.
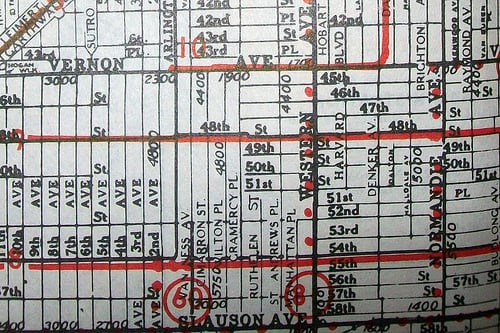
Image from davecito.
According to a recent analysis published in Access Magazine, existing traffic estimates — as collected in the Institute for Transportation Engineers’ (ITE) Trip Generation Manual — are faulty, and the impact on urban development is both surprising and troubling. The manual “substantially overestimates trip generation rates” with significant consequences, writes Adam Millard-Ball, assistant Professor in the Department of Environmental Studies at the University of California, Santa Cruz. And the rates are “often inappropriate for evaluating traffic, fiscal, and environmental impacts.” So areas are being developed around car rides that are never actually taken.
The Trip Generation Manual is the standard reference manual for determining traffic for new development; the manual lists data on trip quantity for 172 varied land uses. As Millard-Ball writes, “Some of the land-use categories are remarkably specific, such as ‘Batting Cage’ or even ‘Coffee/Donut Shop with Drive-Through Window and No Indoor Seating.’”
While the manual’s trip rates are recognized as not necessarily relevant for transit-oriented developments, mixed-use centers, and other developments where people will visit via cycling, walking, or public transit, the other trip rates found in the Manual haven’t been questioned much. Millard-Ball compared national estimates on vehicle trips based on ITE rates with the same rates found in the 2009 National Household Travel Survey, “the most comprehensive” survey in the country.
How do the two compare? The ITE’s calculation results in an estimate 55% higher than than the NHTS’s. That’s an over-estimate that exists in every land-use type category except one. For example, in the single-family detached residential land use category, the NHTS estimated 170,778 trips; the ITE estimated 253,844. That’s a 49% overestimate. In the commercial education land use category, the NHTS estimated 13,748 trips while the ITE estimated 41,024 — a staggering 198% overestimate on the part of the ITE.
So what gives? The data implies that the ITE’s numbers are not based on a “representative sample.” Instead, they are pulled largely from voluntary submissions of traffic counts taken from specific developments — likely those that are more traffic-heavy. Yet this potential explanation is still “somewhat speculative, as the Trip Generation Manual says almost nothing about the characteristics of the developments surveyed beyond their size, and ITE refuses to release further specifics, citing confidentiality constraints.”
We do know, however, that ITE recommends that certain developments submit traffic counts: those with “reasonably full occupancy,” are “mature” and “economically healthy,” and have the “ultimate characteristics of a ‘successful development.'” Of course, using traffic counts only from successful developments doesn’t provide accurate data on how much traffic there is, or will be, on average. Not all developments are successful, and planning around booming businesses leads, as shown in the research, to greatly inflated estimates.
Another key point: ITE’s estimates seem to be rising over time. While NHTS data indicates that annual trips in the US grew by 89 million, ITE data says that annual trips should have jumped by more than double the NHTS estimate: 189 million. While household travel has either peaked or is, possibly even dropping, recently, both residential and non-residential projects continue to be developed. Using ITE’s rationale, “each new house, apartment, office, and factory should be generating additional trips, thus leading to significant travel growth throughout the country. But in reality, total trip-making in the US has been relatively flat since 1995.”
Here’s the crux of the problem: ITE provides the average trip generation rate — which is the number of trips to be expected at any given development — and not the marginal trip rate, which is the rise in total trips as a result of the same development. This marginal rate will usually be less than the average “because some new trips merely substitute for old ones.”
ITE doesn’t account for diverted trips; their formula assumes new trips will be made to new developments. While some new trips will be made, such as those made by new workers commuting to new jobs, new developments will also result in diverted trips — trips that aren’t new but are simply replacing old trips, such as when a person decided to shop at a newly opened grocery store over an old one. “New development projects do not normally generate trips… at the regional or national scale, but simply reshuffle existing ones around.”
While the ITE does somewhat account for the average and marginal rate differences, its formula “only partially captures the trip substitutions that cause the average rate to exceed the marginal rate, because even primary trips do not necessarily increase travel at the macroscopic scale.” The result? High traffic count overestimates. So, what’s the solution? Millard-Ball recommends that planners seek out trip generation data that’s specific to the “local characteristics” of the new development in question.
Most of all, planners should keep in mind that traffic levels in the country have hit a plateau, despite the fact that development is booming; those two trends are “incompatible with the idea that new development ‘generates’ traffic at any scale beyond the very local.” But by seeking out local data and accounting for the phantom trips factored into the ITE’s data, planners can help craft more transit-focused, people-friendly communities.


Category: municipal, Regulations
